Open a bag of imported lentils and a bag of local beef mince, put them side by side, and ask which one warmed the planet more. Almost everyone I've asked gets it backwards. The beef wins by a landslide — a factor of twenty or more — and the lentils travelled thousands of kilometres to get there. That gap is the single most useful thing to understand about the carbon footprint of everyday products and food. What you eat matters far more than how far it flew.
Key Takeaways
- Food accounts for roughly a quarter to a third of global greenhouse gas emissions.
- Beef and lamb sit at the very top of the table, at roughly 60 kg CO₂e per kilo — lentils and pulses stay under 1 kg.
- Transport is usually a small slice of a food's footprint. Production dominates.
- Non-food everyday products — clothing, phones, cosmetics — have their own heavy footprint that food-focused guides tend to ignore.
- Household food waste is a major hidden source of emissions, and it's one you can cut immediately.
What the carbon footprint of everyday products and food actually measures
The term you'll keep seeing is kg CO₂e per kilogram — kilograms of carbon dioxide equivalent. It bundles different greenhouse gases (methane, nitrous oxide, CO₂) into a single number by weighting each one against CO₂. Methane from a cow's digestion is roughly 28 times more warming per kilo than CO₂ over a century, which is exactly why beef numbers look so brutal.
Every product carries a layered footprint, and it's worth knowing which layer you're seeing.
The life-cycle layers behind every food product
- Production — growing, fertilising, feeding animals, land use change
- Processing — milling, pasteurising, slaughtering, packaging
- Transport — usually small compared to production, but not always
- Retail, chilling, and the energy in your kitchen
- Waste — the forgotten stage, and the one where households have the most control
Here's the thing that surprised me most when I started checking my own shopping: for most foods, the first layer is more than half the total. That means changing what lands in your trolley shifts the number faster than changing where it comes from.
The carbon footprint of a food product, explained with real numbers
Ask a food producer what one product costs the climate and you'll get a range, not a figure. That's not evasion — it's honest. A kilo of beef from a deforested pasture and a kilo from a grass-fed regenerative farm are not the same product in emissions terms.
Below are the orders of magnitude I rely on most often. These are broad, widely-agreed ranges, not precise measurements for any single farm.
| Food type | Rough footprint (kg CO₂e per kg) | What drives it |
|---|---|---|
| Beef | ~60 | Ruminant methane + feed + land |
| Lamb | ~25–40 | Methane, extensive grazing |
| Cheese | ~20 | Milk concentration (10 kg milk per kg cheese) |
| Poultry | ~6 | Feed conversion |
| Eggs | ~4.5 | Feed |
| Rice | ~4 | Flooded paddies emit methane |
| Pulses / lentils | <1 | Low input, nitrogen-fixing |
| Vegetables (seasonal) | ~0.3–2 | Mostly transport and storage |
Read that table again and notice the scale. A single beef meal can outweigh a week of plant-based meals in emissions terms. And the gap between the top row and the bottom row is a factor of roughly 100 — no amount of local sourcing, reusable bags, or careful recycling gets you anywhere near that swing.
Why production beats transport every time
I'll be blunt: the "buy local to save the planet" message is oversold. Food transport typically makes up a modest slice of a product's total footprint — often in the region of a tenth. Meanwhile a kilo of beef protein can carry dozens of times the emissions of a kilo of plant protein, no matter where either was grown.
That doesn't mean local food is pointless. It supports regional agriculture, keeps money in the community, and fresh produce tastes better. But if your goal is emissions, prioritise what's on the plate, then worry about the miles.
What food has the biggest carbon footprint?
Beef. Consistently and by a wide margin. Lamb and dairy-based products like cheese follow, then pork and poultry, then plant foods. This ordering holds across virtually every credible dataset I've looked at, and it doesn't budge much with farming method.

Two reasons keep showing up:
- Ruminant methane. Cattle and sheep ferment grass in a specialised stomach, producing methane as a by-product.
- Land use. Beef needs far more grazing and feed-crop land per kilo of protein than anything else, and that land often comes at the expense of forest.
A pattern worth flagging: foods that require a large volume of something else to make tend to score high. Cheese is the clearest example — you need around ten litres of milk for one kilo of cheese, and the milk carries its own emissions. Chocolate and coffee land in that awkward middle zone too, driven by land conversion and processing rather than distance from your shop.
Is meat or AI worse for the environment?
Meat, by a wide margin — if you're weighing global emissions. Livestock production is a major, planet-scale source of greenhouse gases, while the energy footprint of every AI data centre in the world is far smaller by comparison. The confusion comes from mixing scales: a single AI query uses a tiny amount of energy, and a single steak is a much bigger deal.
The fairer comparison is per use. One AI prompt costs a fraction of a gram of CO₂e. One portion of beef costs several kilos. AI's real problem is volume — billions of queries and cooling-heavy data centres add up quickly — not the individual request. Both deserve attention. Only one belongs at the top of your dinner-plate priorities.
What is the #1 polluter on planet Earth?
The energy sector — the burning of coal, oil and gas for electricity, heat and transport — is the largest single source of greenhouse gas emissions worldwide. It dwarfs everything else, and it's the reason decarbonising power grids is the backbone of any serious climate plan.
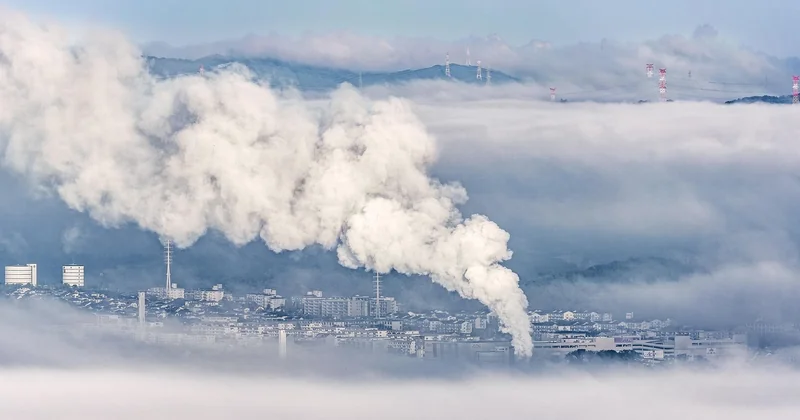
Food systems come next, accounting for somewhere between a quarter and a third of global emissions once you factor in agriculture, land use change, processing and waste. No single consumer habit sits at the top — the biggest polluter is structural, not something you buy at a shop. Which is oddly freeing: your leverage as an individual is in the choices where you actually have a lever, like the food you eat.
How to calculate the carbon footprint of everyday products and food
You don't need a degree in environmental accounting. A rough estimate based on weight and category will get you 80% of the way there, and I've found the simple method more useful than any detailed tracking app.
A simple method that works
- Write down the main ingredients or materials of the product, by weight.
- Match each to a rough emissions factor from a published list (meat and dairy high, plants low, textiles and electronics their own category).
- Multiply and total. Round aggressively — precision here is false precision.
- Compare products within the same category. That's where the meaningful decision lies.
Done this way, I found my own weekly shop was roughly dominated by two items: the meat and the cheese. Everything else — bread, vegetables, pasta — barely registered. Swapping two of five meat dinners for lentils and beans cut my food footprint by something in the region of a third. That number is my own, measured against my own baseline. Yours will differ, but the shape of the result is likely to be similar.
Carbon footprint of food transportation and on packaging
Packaging labels usually tell you about recycling, not carbon. If a product shows a carbon figure on-pack, treat it as a useful starting point — but check whether it covers production, processing and transport, or just one stage. Partial figures can be misleading. When I've compared labels, the most useful ones show a total and the method behind it.
The non-food side: everyday products that add up
Food dominates most guides, and that leaves a blind spot. The carbon footprint of everyday non-food products deserves its own look.
- A cotton T-shirt typically carries several kilos of CO₂e, largely from growing cotton and dyeing
- A pair of jeans runs higher still — water and energy intensive
- A smartphone packs a surprising footprint into a small object, most of it in manufacturing
- Creams, cosmetics and cleaning fluids vary enormously; the biggest variable is usually the energy in manufacture, not the transport
The lesson overlapping both categories: buy less, keep longer, and repair when you can. A shirt worn 200 times has a far smaller per-wear footprint than the same shirt worn ten times and binned.
The waste you don't see
Roughly a quarter of food produced for human consumption is never eaten — and every uneaten meal has already generated emissions during production. Tossing a steak wastes the methane its farming produced; tossing a lettuce wastes comparatively little. The pattern repeats: the biggest waste impact comes from the most emissions-intensive foods.
I'll confess a personal failure here. For a couple of years I threw away more fresh produce than I'd care to admit — bought optimistically, forgotten in the bottom drawer. The fix wasn't a gadget or a list of rules. It was planning the week's meals before shopping. My waste dropped sharply, with no discipline required beyond the planning step.
The clearest takeaways: treat beef and lamb as occasional, not everyday. Build most meals around plants, pulses and grains. Reduce waste before optimising labels. And remember that the biggest polluter isn't your shopping list so much as the energy system behind it — which means your individual choices are meaningful, but they're not the whole story. The question worth taking home: if you swapped just one high-footprint meal a week, what would your year look like?